Tool

2024 Statistics on Diverse Groups

March 2024
Topics Recruitment

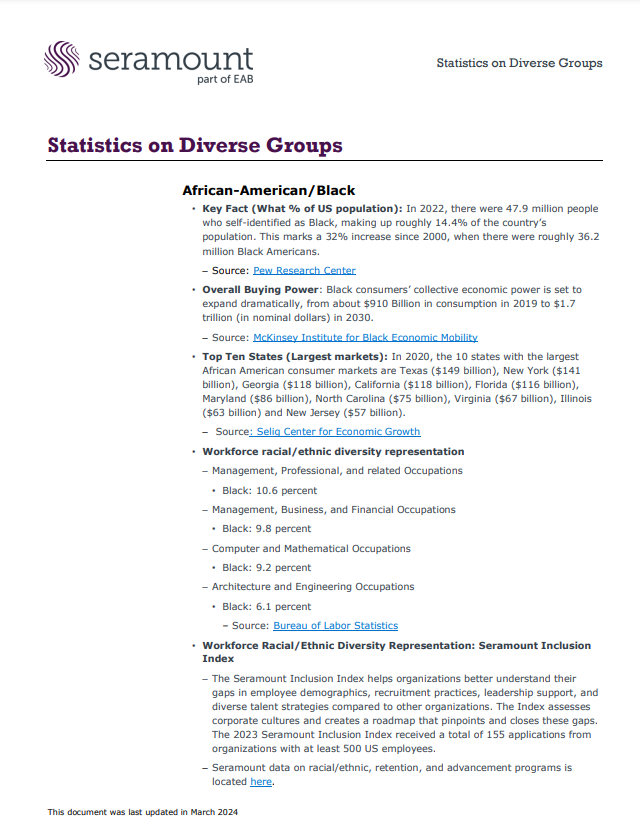
This resource compiles data points about a variety of demographic groups, including gender, race/ethnicity, veterans, caregivers, LGBTQ+, and generation. The research spans topics from percentage of the US population, workforce representation, purchasing power, and more.

Statistics on Diverse Groups African-American/Black • Key Fact (What % of US population): In 2022, there were 47.9 million people who self-identified as Black, making up roughly 14.4% of the country’s population. This marks a 32% increase since 2000, when there were roughly 36.2 million Black Americans. – Source: Pew Research Center • Overall Buying Power: Black consumers’ collective economic power is set to expand dramatically, from about $910 Billion in consumption in 2019 to $1.7 trillion (in nominal dollars) in 2030. – Source: McKinsey Institute for Black Economic Mobility • Top Ten States (Largest markets): In 2020, the 10 states with the largest African American consumer markets are Texas ($149 billion), New York ($141 billion), Georgia ($118 billion), California ($118 billion), Florida ($116 billion), Maryland ($86 billion), North Carolina ($75 billion), Virginia ($67 billion), Illinois ($63 billion) and New Jersey ($57 billion). – Source: Selig Center for Economic Growth • Workforce racial/ethnic diversity representation – Management, Professional, and related Occupations • Black: 10.6 percent – Management, Business, and Financial Occupati

Sign in to view this resource
Please sign in to access this and other member resources. If you are not yet a Seramount member, please email us at [email protected].

Downloads

Related Content