Tool

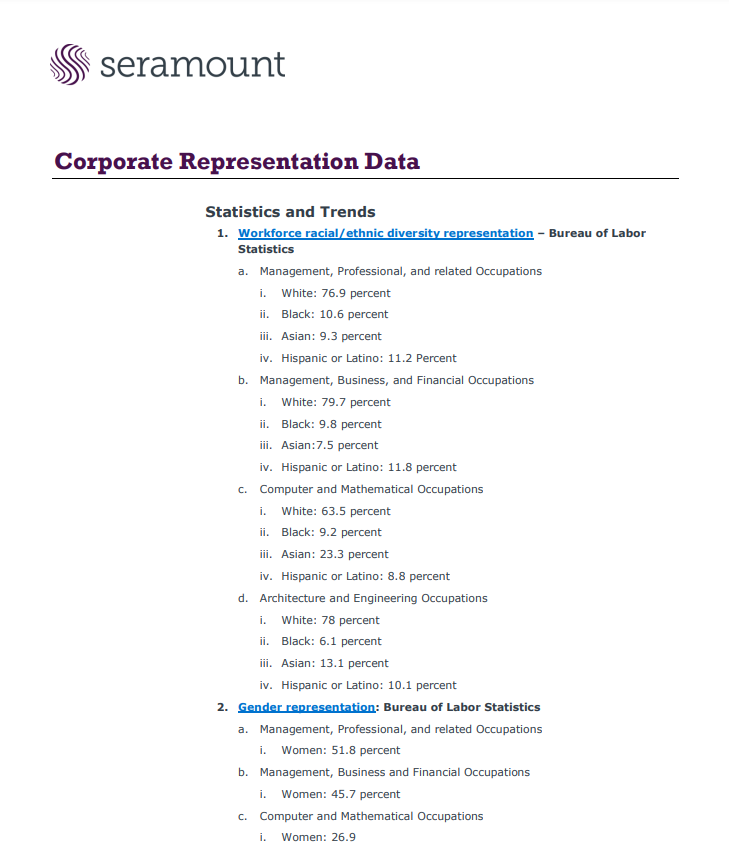
2024 US Corporate Representation Data

March 2024
Topics Recruitment

Data from the Seramount Inclusion Index and the Bureau of Labor Statistics showing the state of corporate representation across a variety of demographic groups.

Corporate Representation Data Statistics and Trends 1. Workforce racial/ethnic diversity representation – Bureau of Labor Statistics a. Management, Professional, and related Occupations i. White: 76.9 percent ii. Black: 10.6 percent iii. Asian: 9.3 percent iv. Hispanic or Latino: 11.2 Percent b. Management, Business, and Financial Occupations i. White: 79.7 percent ii. Black: 9.8 percent iii. Asian:7.5 percent iv. Hispanic or Latino: 11.8 percent c. Computer and Mathematical Occupations i. White: 63.5 percent ii. Black: 9.2 percent iii. Asian: 23.3 percent iv. Hispanic or Latino: 8.8 percent d. Architecture and Engineering Occupations i. White: 78 percent ii. Black: 6.1 percent iii. Asian: 13.1 percent iv. Hispanic or Latino: 10.1 percent 2. Gender representation: Bureau of Labor Statistics a. Management, Professional, and related Occupations i. Women: 51.8 percent b. Management, Business and Financial Occupations i. Women: 45.7 percent c. Computer and Mathematical Oc

Sign in to view this resource
Please sign in to access this and other member resources. If you are not yet a Seramount member, please email us at [email protected].

Downloads

Related Content